
VisFlare Features
Procedural and non-destructive infographics editor in details
Non-destructive and data-driven pipeline
VisFlare offers a fully procedural and data-driven art pipeline. You can entirely change the look of dozens of shapes just by adjusting a single node, or you can inject some attributes from your data into visual shapes. All you need is to insert plain text data into the app and choose template you like. The same data could be visualized in dozens of different ways just choosing different templates or customizing an existing one. Infographics could be instantly downloaded from your web browser in png, jpeg or webp formats.
Node-based system
Instead of most WYSIWYG graphic editors, we use the procedural node-based system to describe the visual shapes and bind them with data. Every VisFlare document is a nodes graph, every piece of which could be a panel, shape, text, or some auxiliary operation. You can link the outputs from one node to the inputs of another one without manual placement and adjustment shapes [1]. For example, you can bind the edge of one shape to the edge of another, link height and width, bind parent panel background color with child text color etc. This is a very flexible zero-code approach, very similar to other popular tools for creators like Houdini, Blender, Unreal Engine, Substance Painter and many others.
[1] During current MVP stage the node editor is in read-only mode, infographic could be created only from existing templates. Check roadmap page for the detailed info.

Dynamic shapes and responsive text
VisFlare allows you to step beyond static vector geometry elements and create dynamic shapes. Lines and points in such shapes could be build based on external data, intersections between other lines, or relative offsets. You can also easily build responsive templates, because font size automatically shrinks according to the available size of the text block.
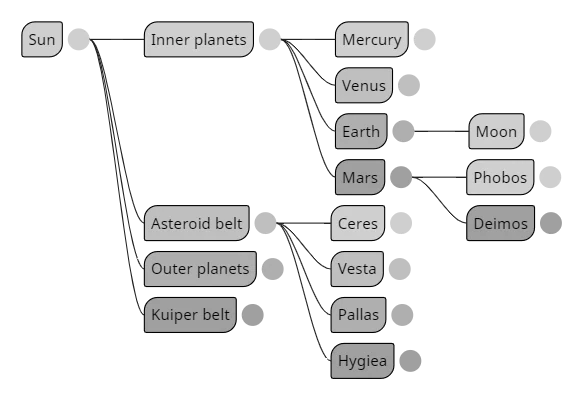
Automatic connectors
It could be a nontrivial task to draw connectors between shapes in a regular vector graphics editor, especially when you need to draw dozens or hundreds of connections. Even if the editor supports "smart" connectors, which can be glued to shapes, you should do a lot of manual adjustments to properly arrange everything. VisFlare does this job only with single Connector node. You just need to set pieces of shapes (points or edges), which can act as joints, and bind them with attribute in your data. Everything else VisFlare does automatically, all connectors will find their own targets and joints.
Dynamic color palettes
You are able to use a custom color palettes and distribute colors among geometry shapes or text blocs using color nodes. For example, colors from a linear gradient can be evenly spread among a group of geometry shapes using Color Range node.